Gosh It’s a Sellers Market
November 20, 2019

November 20, 2019
Welcome to our November newsletter. This month, we’ll help you make informed buying and selling decisions and will offer you some important guidelines for understanding home prices. We realize that buyers and sellers may feel like they’re simply guessing when it comes to determining a fair price for residential real estate. With that in mind, this month we’ll examine:
Based on the October 2019 data, the housing market in San Francisco is a seller’s market.
In the following section, we’ll consider two primary housing trends: median home prices and month’s supply (a combination of sales and inventory). We’ll also examine two secondary trends: number of days on market, and average sold price compared to original list price.
Let’s start by comparing median home prices for San Francisco from October 2019 with prices from October 2018. Yearly comparisons are important because they remove variations due to seasonality.
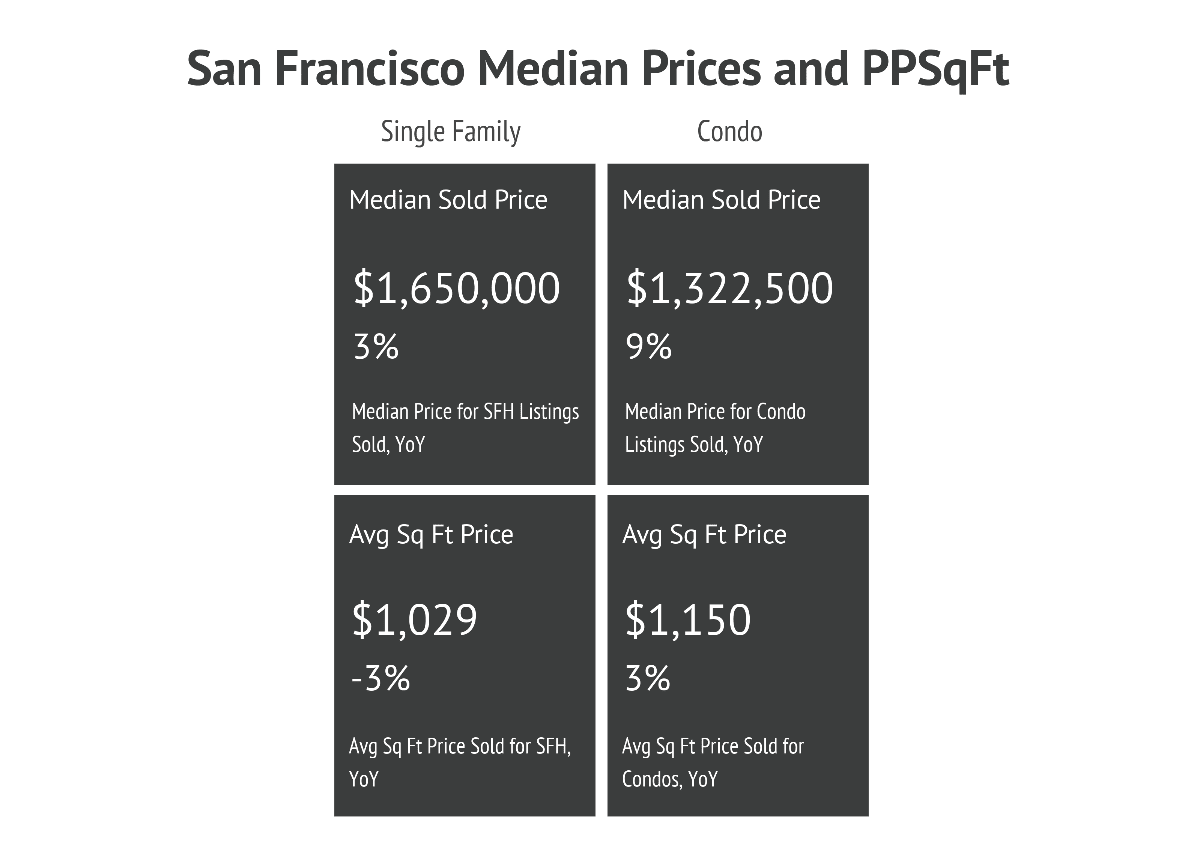
When analyzing median home prices, it’s important to take note of both the direction and the degree of price-change from the same time last year. If home prices have increased by a significant margin (10% or more), then buyers and sellers should expect home values to increase compared to past comps. In San Francisco, median prices have increased by 3% compared to the previous year for single-family homes and 9% for condos, meaning that they are up, but not enough to create significant price increases compared to comparable home sales (based solely on home prices).
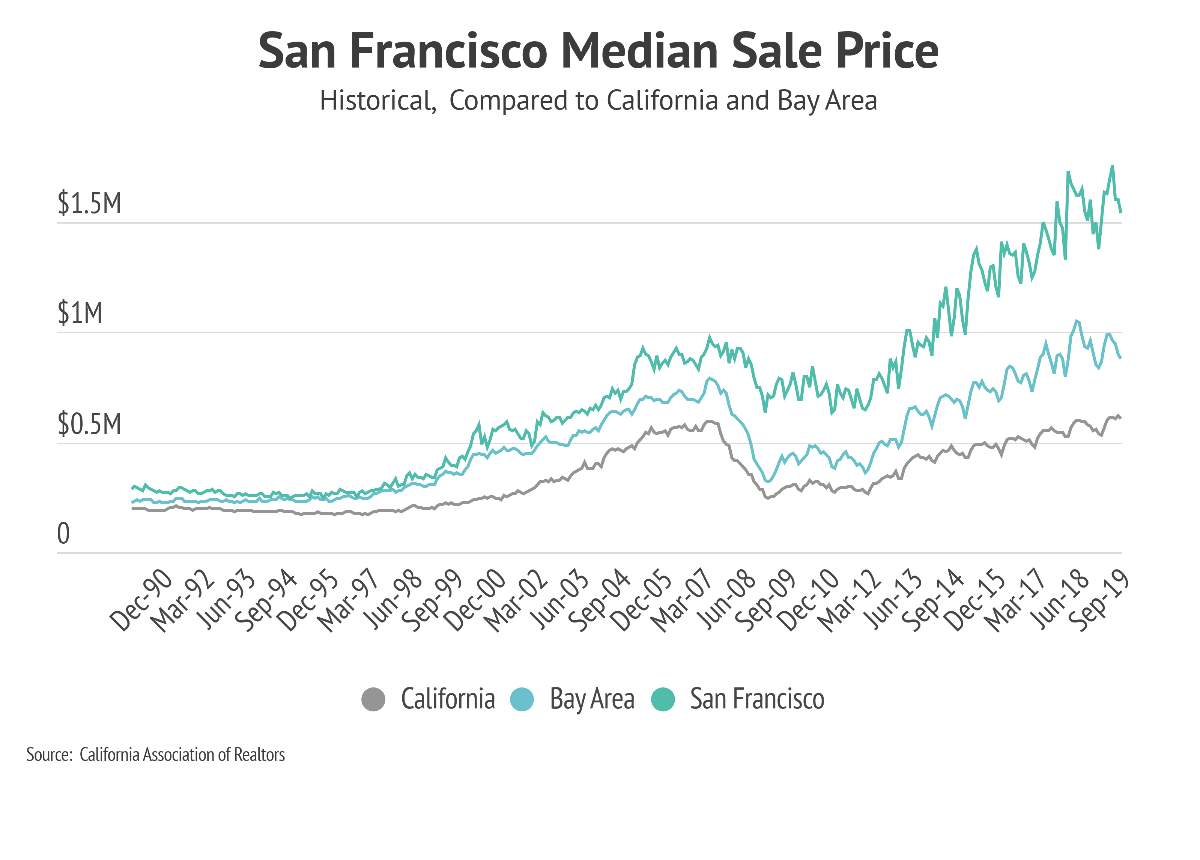
In San Francisco, median home prices saw significant gains year-over-year from 2010 until the beginning of 2019. From that point on, home prices leveled off and closely tracked those of the previous year. On its own, this data would suggest that homes should be priced in line with their previous sold comparables.
Next, let’s examine month’s supply.
Month’s supply measures how many months it would take for all current listings on the market (including listings under contract) to sell at the current rate of sales. Nationwide, most analysts consider six months of supply to be a balanced market between buyers and sellers. A low level of supply means that there’s more buyer demand than there are homes for sale. In this environment, sellers may list their homes for more than the comps would indicate, get multiple offers, command higher prices through a bid process, and/or sell the home quickly. For a market with high supply, generally, the opposite is true.
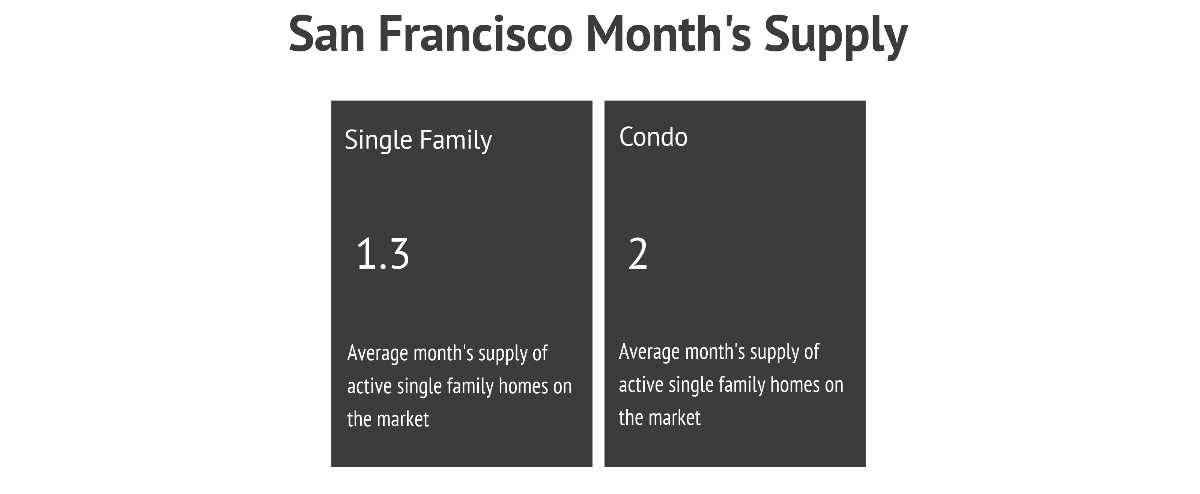
Month’s supply is well below the six-month level in San Francisco, which indicates a seller’s market with plenty of buyer demand. Even for California’s high-demand market where experts define “balanced” as having a much lower month’s supply, 1.3 is incredibly low. Simply put, there are many more buyers than available housing.
Again, supply measures the time it would take to sell (sales) all of the current listings (inventory). We can take a closer look at those two individual factors below.
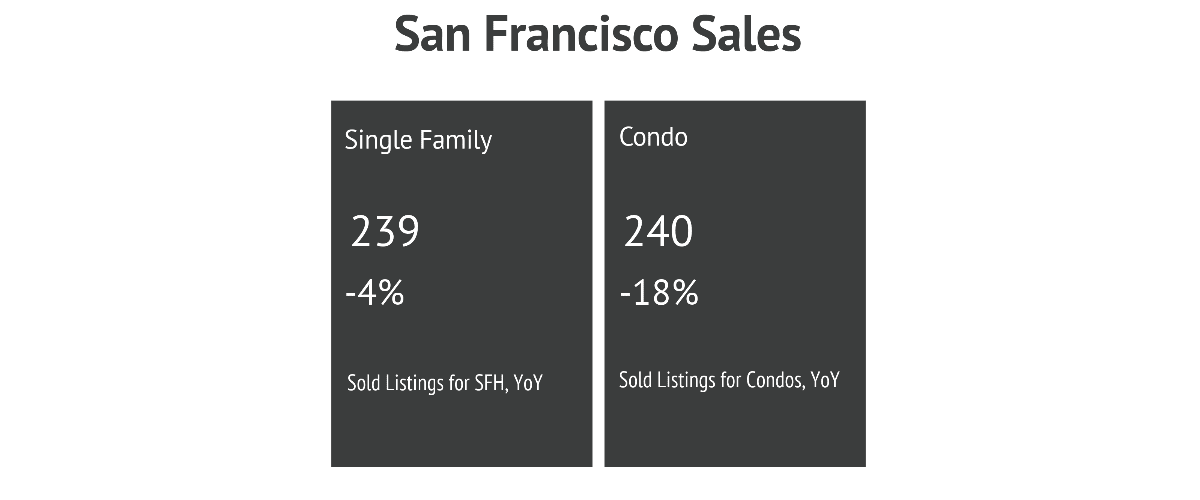
Sales measures how many homes are sold in a given month. For a seller, this number is driven by the level of demand and the number of buyers in the market. Very low or very high sales can influence how a seller prices their home. For example, very low sales, which equates to very low demand, might encourage sellers to price their homes more competitively.
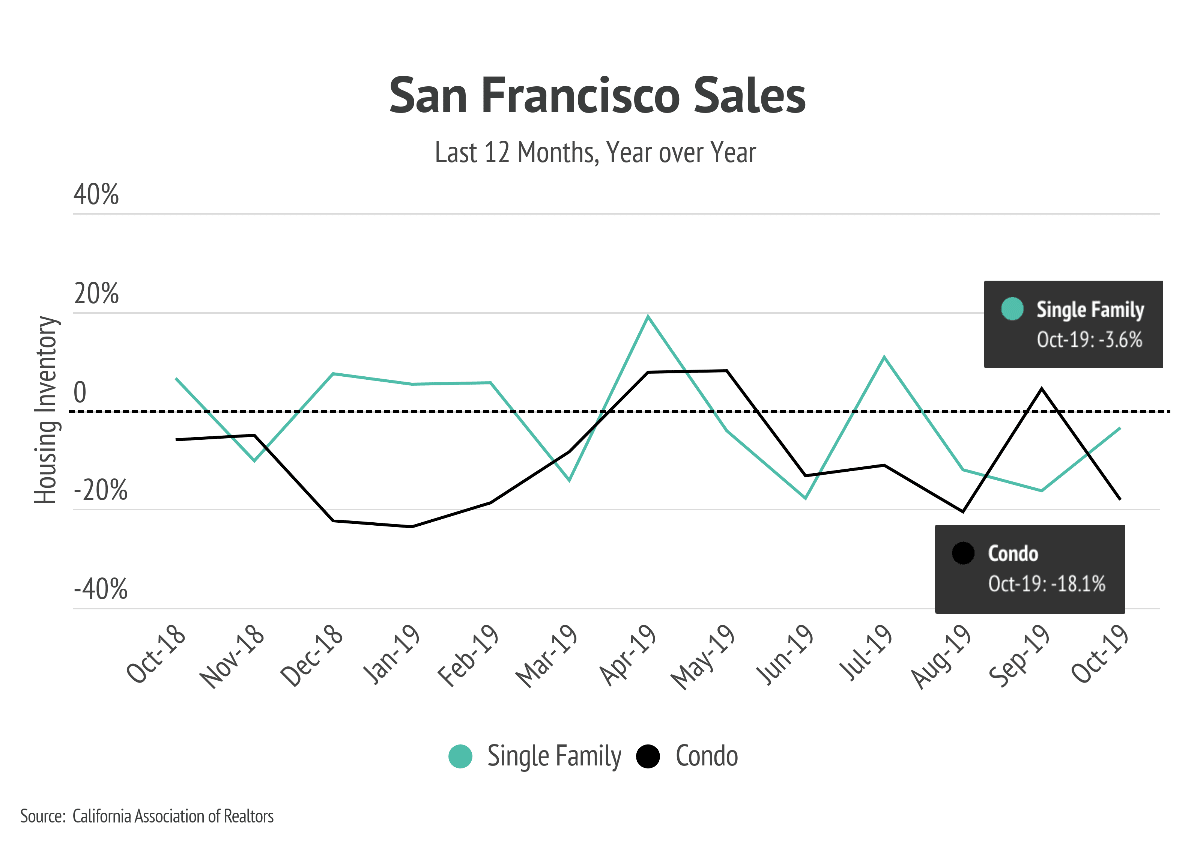
Sales in San Francisco have trended lower over the past year and are down for both single family homes and condos. Typically, this would indicate that buyer demand is down (and suggest a buyer’s market) but much of the slow sales has to do with a lack of available homes to buy.
This brings us to inventory.
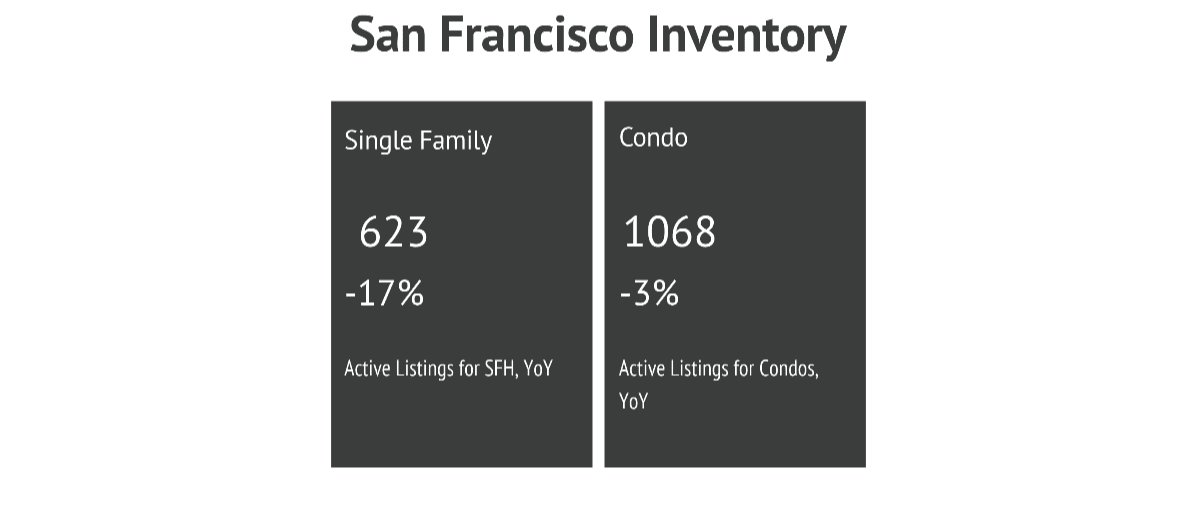
Inventory measures the number of homes listed for sale. For sellers, it’s an indication of how competitive the market is. For buyers, it measures how many options are available on the market. Very low or very high inventory can influence how a seller prices their home. For example, higher inventory levels mean that sellers have more competition, and potential buyers have more choices. In this scenario, a seller might price their home more competitively, while a buyer may come in with a lower bid, especially if they’ve seen lots of price reductions in the area.
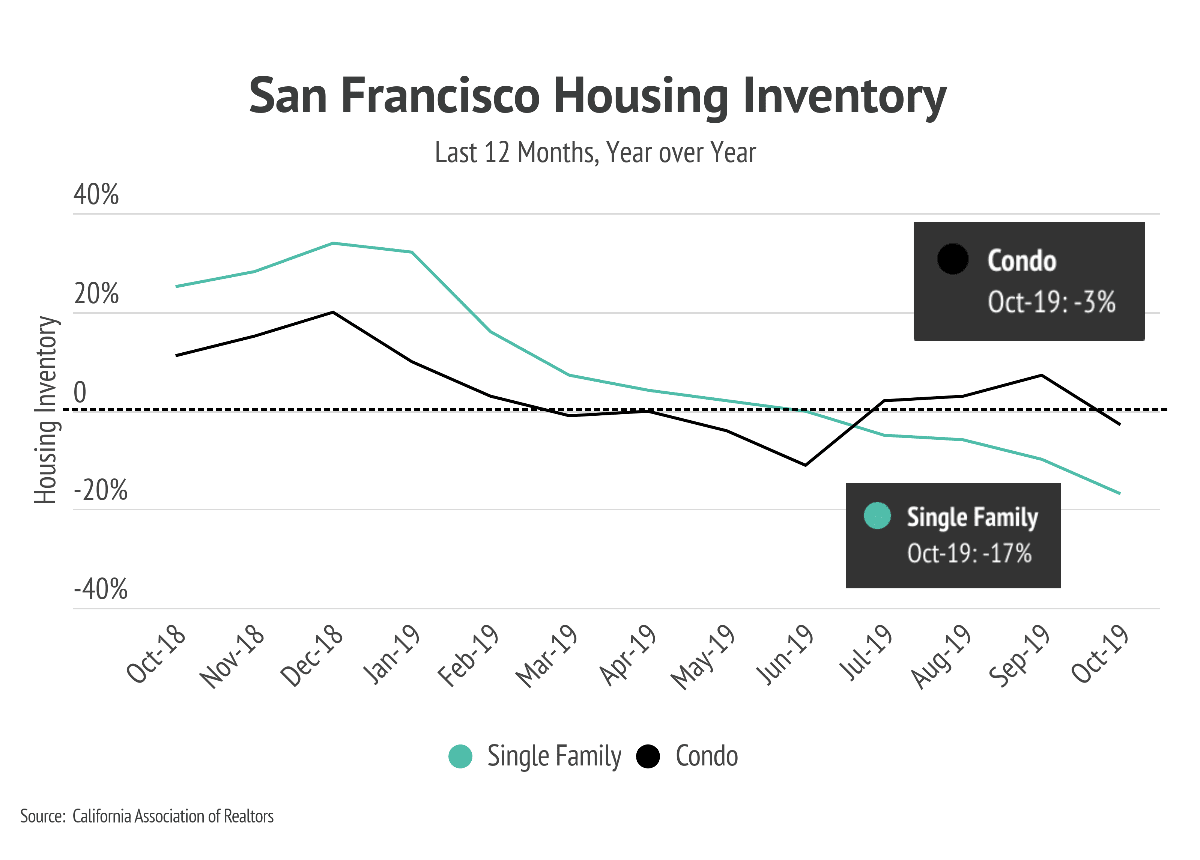
Inventory levels in San Francisco have fallen year-over-year from levels that were already extremely low. With very little available inventory, sellers have the upper hand.
Now that we’ve thought about home pricing based on the CMA and the two primary market trends (median home prices and supply), let’s shift our focus to days on market and the average sold price as compared to the original list price. We’ll see how understanding both of these factors can help sellers avoid the critical mistake of overpricing a home.
The Risk of Overpricing Homes in San Francisco
While underpricing a home can leave money on the table for the seller, the market usually corrects this mistake naturally when multiple offers drive the price back up to its market value. The real danger lies in pricing a home too high—a mistake that can be made even in a seller’s market and one that leads to increased time on the market and a lower final sales price.
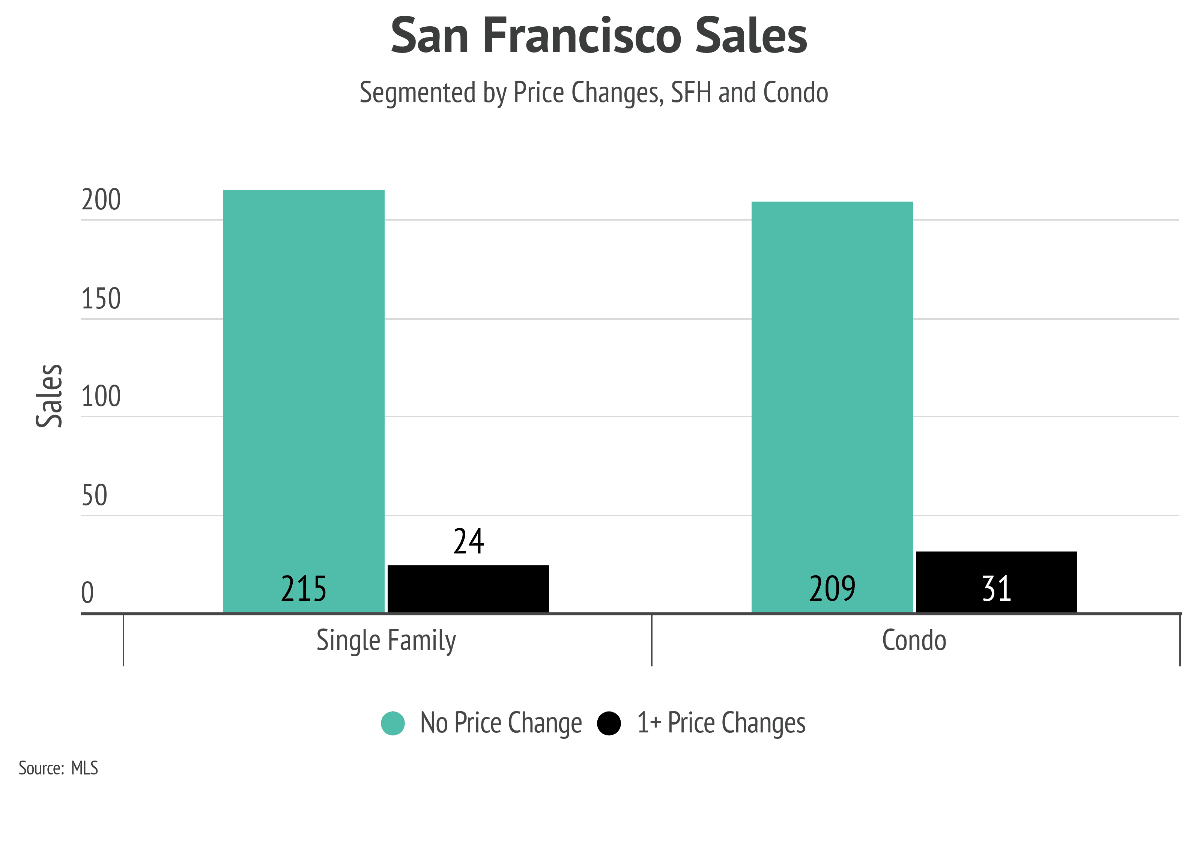
Using market data from October 2019 for San Francisco, let’s separate sold homes into two categories: homes priced correctly (and sold without a price reduction) and homes that were overpriced (and had one or more price reductions).
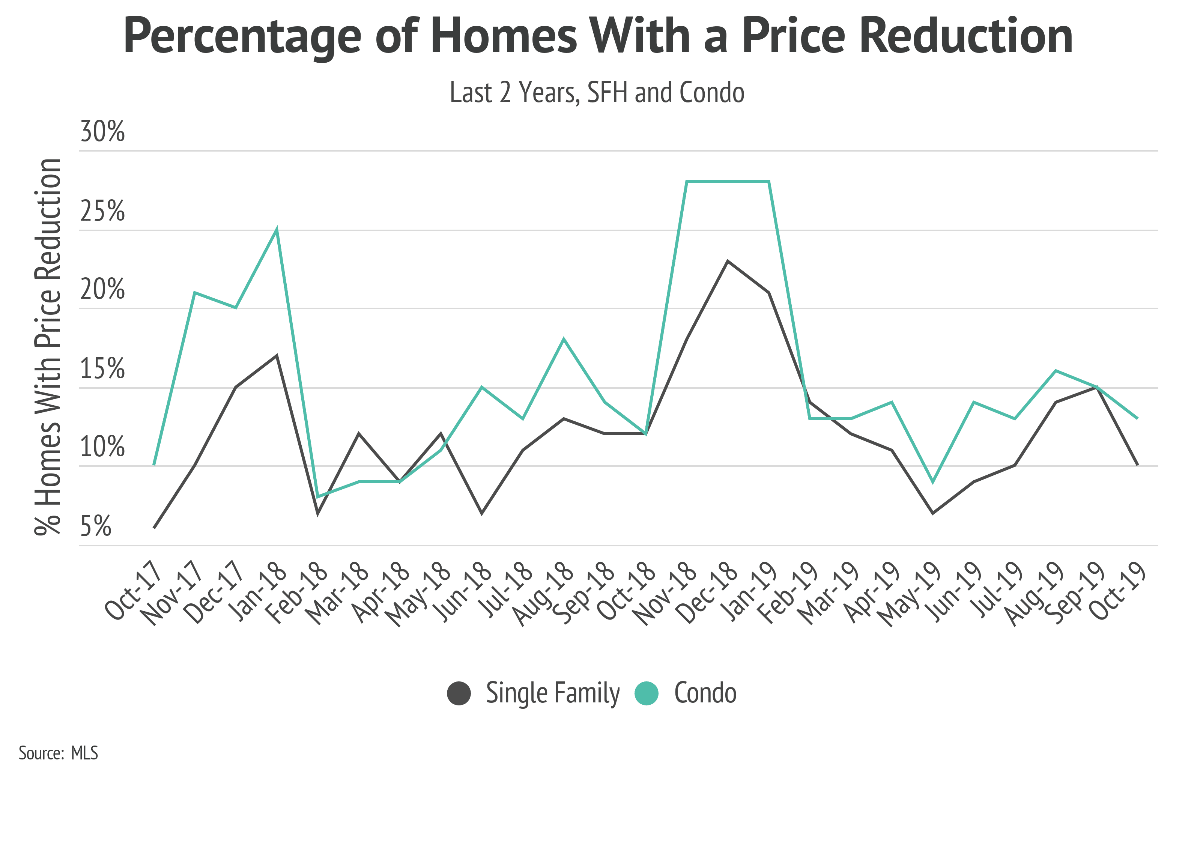
It is important to realize just how common price reductions are even in a seller’s market. In San Francisco, over 10% of single-family homes experienced a price reduction. This number was higher for condos, where 15% had reduced prices.
Across all three areas, a clear pattern emerges when we look at the number of price reductions over the last two years: the number of price reductions goes up when home prices are trending down. When interest rates caused home prices to decline this past winter, the number of homes that had a price reduction rose to over 20%.
The chart shows the final sold price of a home compared to its original list price. What’s clear is that overpricing can lead to a loss of home value.
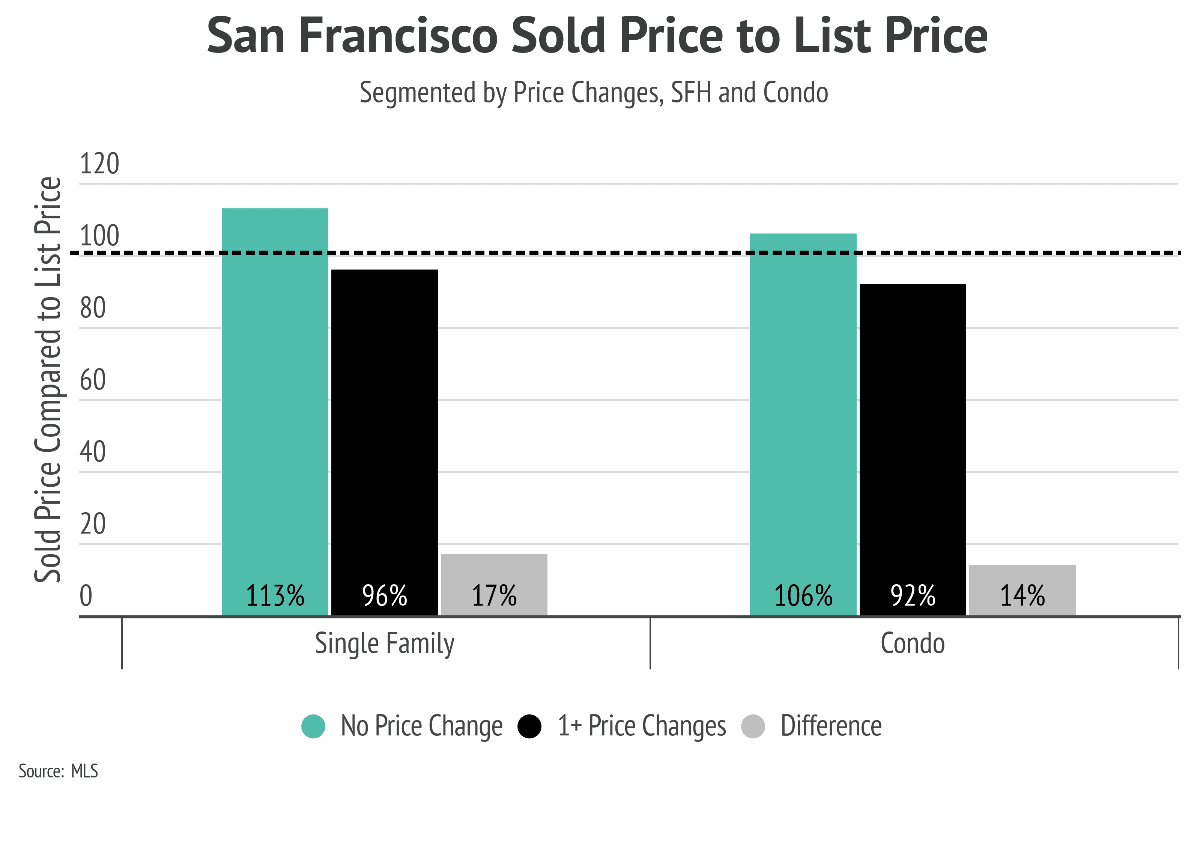
Single-family homes without a price reduction sold for 113% of their original list price, while homes sold with one or more price reductions sold for 96% of their original list price. That’s a difference of 17%. Using the median sold price ($1,650,000) for single-family homes in San Francisco in October, that translates to an average per-home loss of $280,500. The difference in home value remains consistent regardless of the time of year.
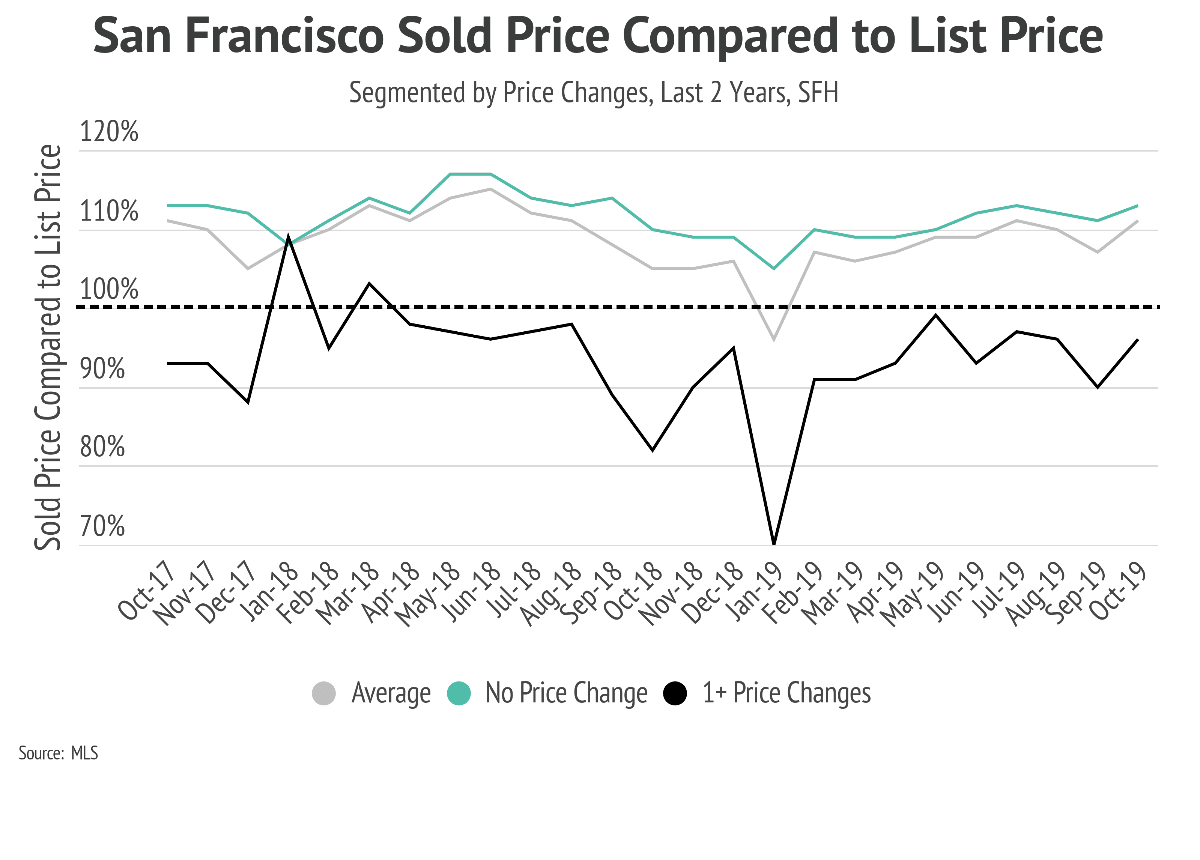
We can use price-change data to understand the conditions of the market (favoring buyers vs. sellers or remaining neutral) and for pricing and negotiating offers. When homes consistently sell above list price, the market is considered to be a seller’s market, and buyers and sellers should expect to negotiate accordingly. In San Francisco, buyers and sellers should expect to negotiate a home above its listing price, assuming that the home is priced correctly.
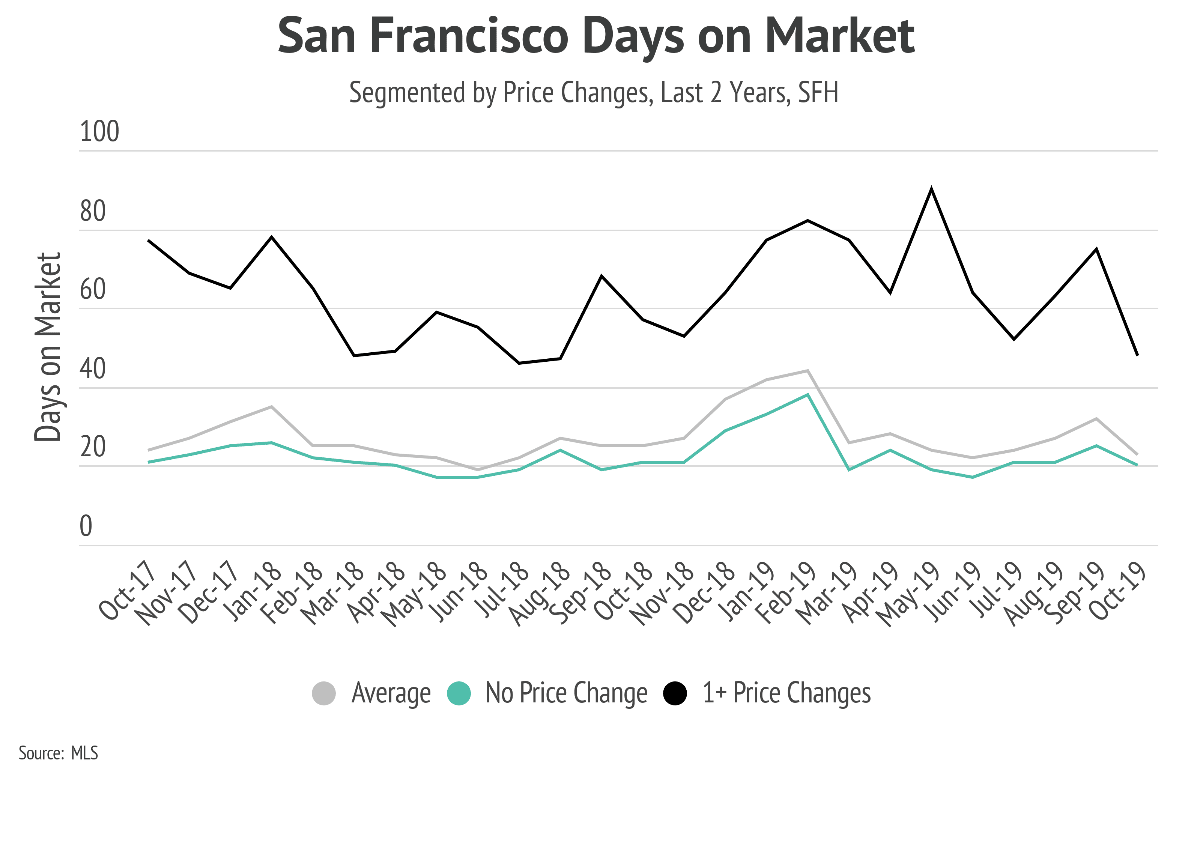
Let’s look at the median number of days on market for homes sold in October to see how overpricing played out.
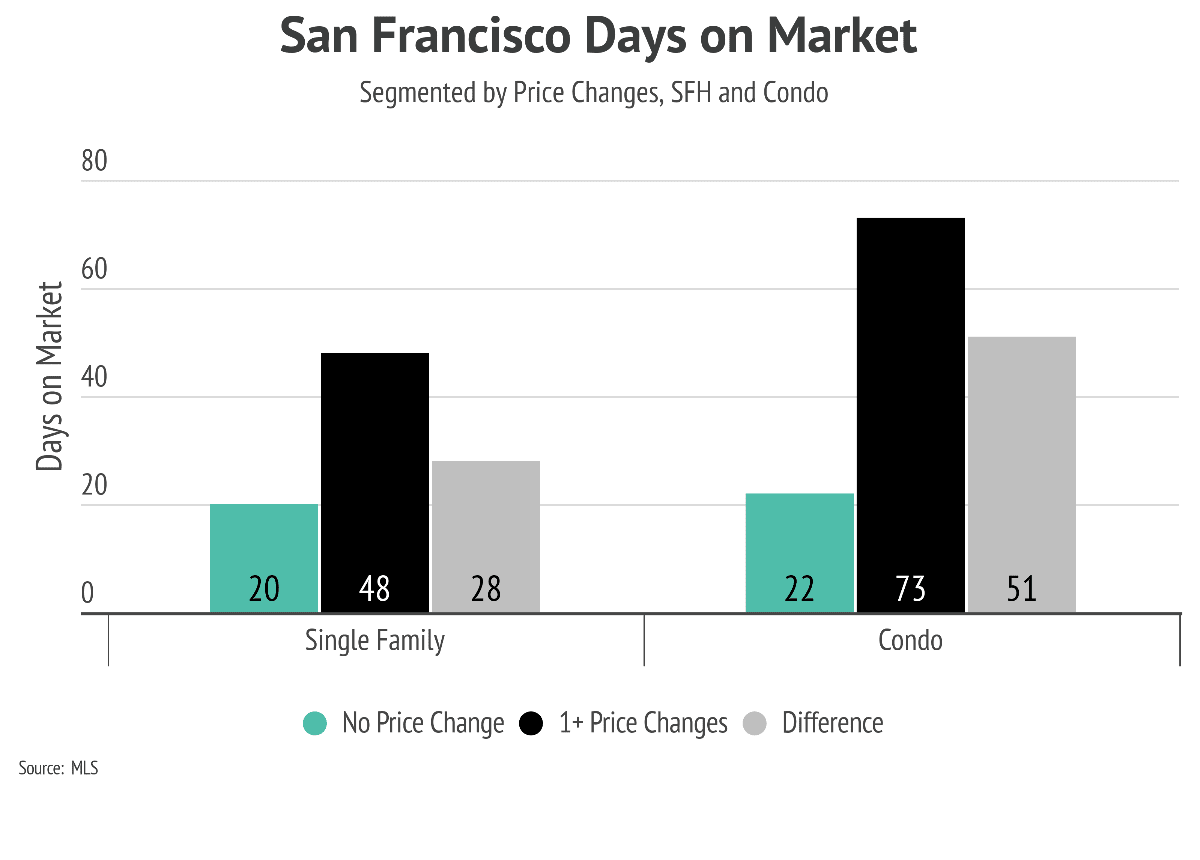
Single-family homes that sold without a price reduction were on the market for only 20 days, while ones with one or more price reductions spent over twice as long (48 days) on the market. That extra month results in additional mortgage payments and extra days spent staging, showing, and selling the property. For time-sensitive sellers, the impact of overpricing is even riskier.
We know that overpricing a home comes with serious consequences. So why does it happen so frequently? Sometimes unlucky sellers simply get caught on the wrong side of the market and have to adjust their price accordingly. This can happen when interest rates increase, buyers get sidelined, and both demand and home values diminish. In this instance, the only way to sell is to be more competitive than everyone by slashing the list price.
More often, however, overpricing occurs either because the seller overestimates the value of their own home or the agent fails to help them set the right price. Unfortunately, some agents win business by claiming they can sell a home for an unrealistic price. The promise can be hard to resist. Who wouldn’t want extra cash to help fund the kids’ college education, pay down debt, or afford a bigger home?
The reality, of course, is that when an overpriced property remains on the market for longer than average, price reductions follow. Ultimately, the final sales price falls well below where the seller should have listed the property in the first place.
Pricing a home correctly takes both experience and market knowledge. To navigate the shifting real estate landscape, buyers and sellers need an agent they can trust. We’re dedicated to helping our clients achieve their goals, and we welcome you to contact us with questions about the current real estate market or for an evaluation of your home or condo.
Stay up to date on the latest real estate trends.

April 16, 2024

April 12, 2024
Buy and Sell Bayview homes

April 4, 2024

March 27, 2024
Staging your property isn't just a suggestion – it's a strategic move
You’ve got questions and we can’t wait to answer them.